Before You Deploy
Yes. Envizor is used everyday on dozens of Community Air Monitoring Plan projects. Nearly all Envizor users notice a remarkable improvement in time spent deploying and maintaining their CAMP stations. There are a wide variety of compatible sensors. We’d be happy to explore your application if you do not see it listed below: There are three serial ports for up to three serial communicating sensors simultaneously. Additionally, there is a Modbus expansion port for additional Modbus devices. Yes. The most common request is a 1 minute interval and a rolling 15 minute average for Dust and VOCs. So, we’ve enabled those by default! Other averaging intervals, ie. 5 minute, 10 minute, can be accomplished with just a few extra steps on the Sensor Configuration screen. The Cellara modem will always make an initial call to the server once it is supplied power. Then, it will begin its Active Schedule. The Active Schedule can be customized. Typically, we set them to call in once every 5 minutes. This means that calls will be placed on the tens and fives, ie. hh:00, hh:05, hh:10, hh:15, etc., while it is powered. Yes. Customized alerts can be sent via email or text to any user. The alert condition is set up on the server. Therefore, the alert can only be sent to users upon the next scheduled call after the alert limit has been exceeded. If the Active Schedule is set to 5 minutes, then the biggest potential delay would be up to 4 minutes. The typical Envizor station requires up to 1.2 amps per hour from a 12VDC battery. The size of the battery will determine how long the station will operate. Smaller SLA batteries can be placed in the enclosure for easy daily set ups and overnight charging. Large AGM batteries can be deployed and placed near the enclosure in weather resistant boxes for longer run times. Solar panels can be added for even longer runs. Even better – weather resistant AC power adapters are available if there is an AC power source nearby. Go to the Accounts & Users page. Select Request New Account. Fill out the form and submit. We’ll get you set up right away. Envizor can display each station all on a single Dashboard or we can split them into separate accounts. It’s fully customizable and up to you!
After You Deploy
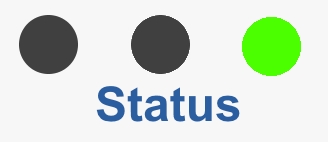
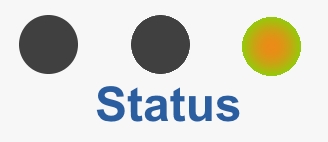
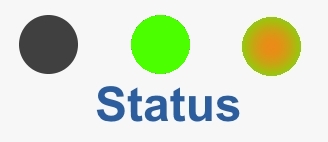
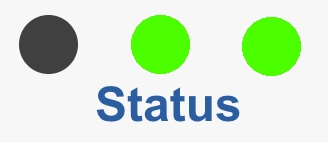
The Status lights on the top of the Cellara device will tell you if your sensors are successfully connected. This is likely because you are using an outdated browser. We suggest using Google Chrome or another similar, up-to-date browser for the best experience. There are two convenient ways to set up additional users. Limit alerts are customizable for each channel that is reporting on a Cellara device. To set up a limit alert: The time stamp on the alerts are UTC (Coordinated Universal Time). Using UTC allows our server to write the message without verifying each individual recipient’s timezone. This simplifies delivery of the alerts and greatly reduces bounced messages. Keep in mind that nearly all of the popular messaging apps will display a timestamp of each message on the recipient’s device. Yes. We find that it is much easier to manage your stations when they have a meaningful name and are organized on the Dashboard. The Device tiles on the Dashboard will be organized numerically first (0 to 9), then alphabetically (A to Z). To change the name of your stations: The Device tiles on the Dashboard are organized by their Name numerically first (0 to 9), then alphabetically (A to Z). Refer to the previous question for instructions on renaming your devices. Click on the Device tile at the bottom of the Dashboard. This will open the Details page. Scroll down until you see the Sensor Readings tile. You can adjust the “View Prior” time periods and “from date:” in the fields on the top-right corner of the tile. Press Refresh to view the data. By default, data will be displayed in Graphs organized by the unit of measure. At the top of the tile, you can toggle between the Graph Data and Table Data tabs according to your preference. Once you have selected a Device from the Dashboard, you will be viewing the Details page. This page is great for viewing a snapshot of your data. For downloading, we recommend using the Sensor Reports page from the menu on the left. This gives you control over which sensors are displayed. Data can be downloaded in two manners: